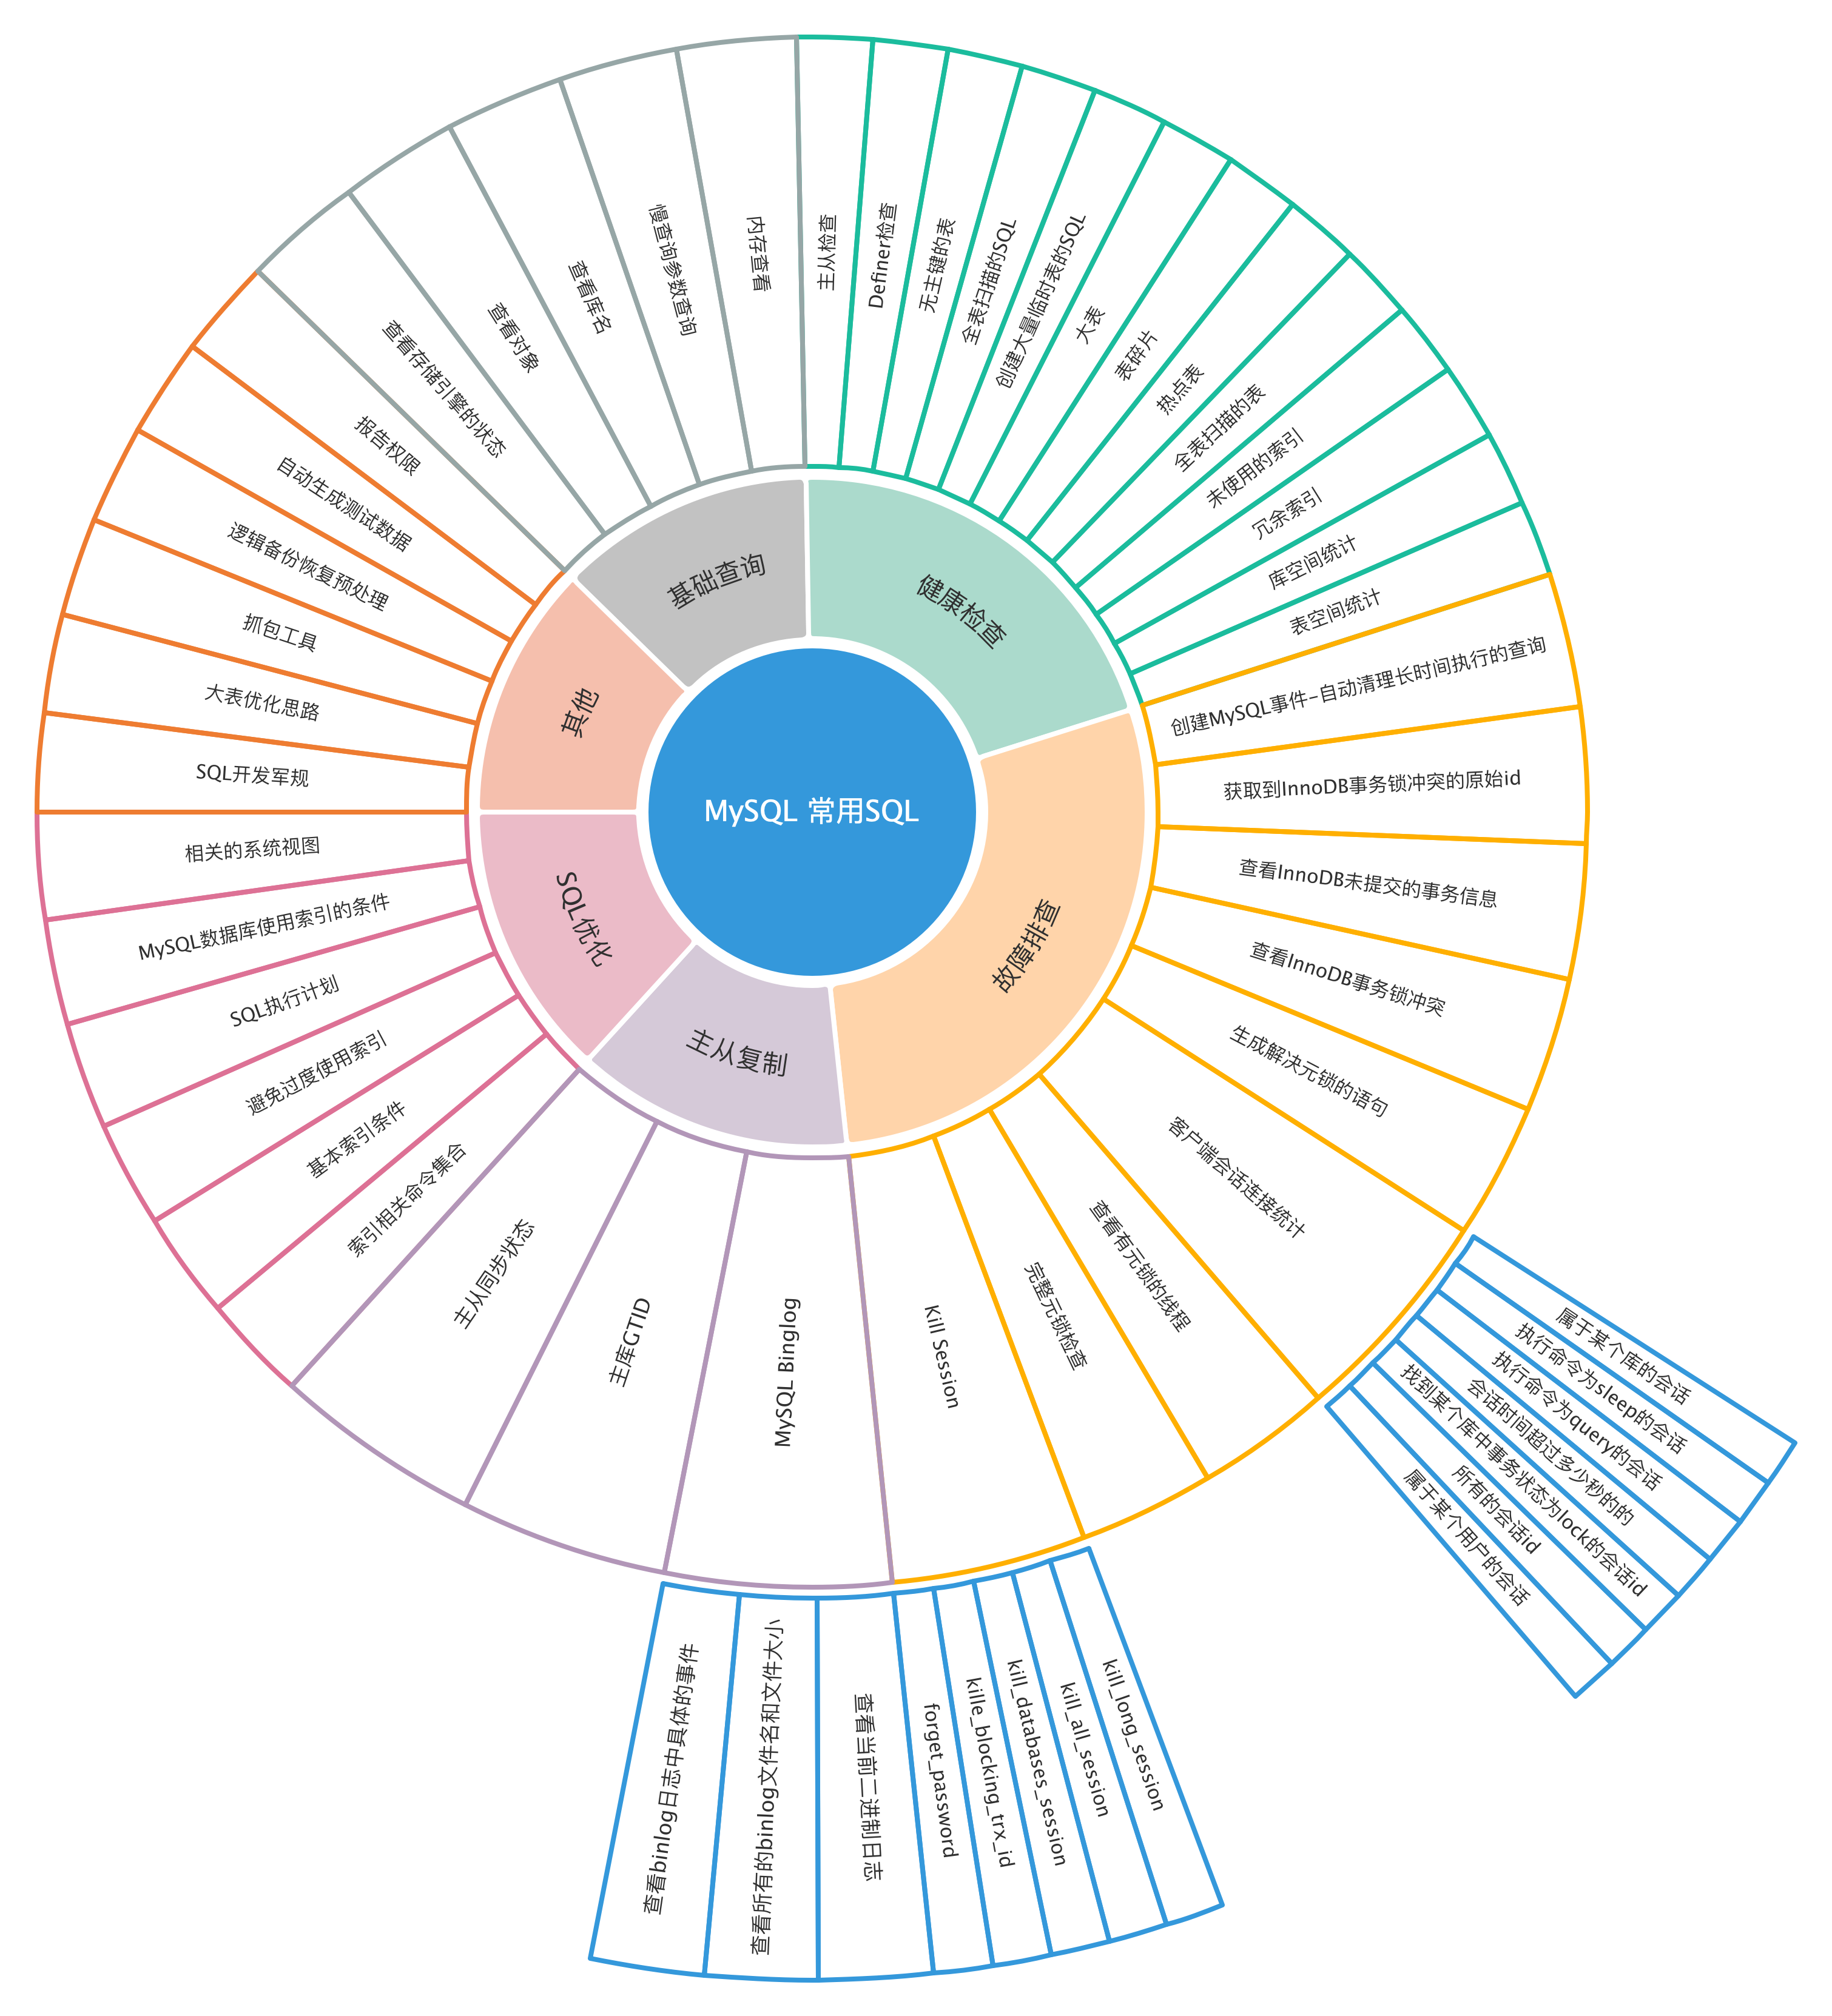
MySQL 常用 SQL (精品)

支持的MySQL数据库版本:5.5 5.6 5.7 8.0

批处理

批量生成删除和创建视图的语句

--批量生成删除视图语句
select concat("drop VIEW ",TABLE_SCHEMA,".",TABLE_NAME,";") from information_schema.VIEWS where table_schema in ("xx","xx2");

--批量生成创建视图语句
select concat("create DEFINER=`zyadmin_dba`@`%` SQL SECURITY INVOKER VIEW ",TABLE_SCHEMA,".",TABLE_NAME," as ",VIEW_DEFINITION,";") from information_schema.VIEWS where table_schema in ("xx","xx2");

批量生成删除和创建索引的语句

-- 生成删除索引的SQL
SELECT
concat(
'alter table `',
table_schema,
'`.`',
table_name,
'` drop index `',
index_name,
'`;'
)
FROM
information_schema.STATISTICS
where index_name != 'PRIMARY' and table_schema in ('xx','xx2')
GROUP BY table_schema , table_name , index_type, index_name;

-- 生成创建索引的SQL
SELECT
concat(
'alter table `',
table_schema,
'`.`',
table_name,
'` add ',
case when NON_UNIQUE=0 then 'UNIQUE'
else '' end,
' index `',
index_name,
'` (',
GROUP_CONCAT(concat('`',column_name,'`') order by SEQ_IN_INDEX),
');'
)
FROM
information_schema.STATISTICS
where index_name != 'PRIMARY' and table_schema in ('xx','xx2')
GROUP BY table_schema , table_name , index_type, index_name;

--对比索引信息
--检查主键是否一致
SELECT
table_schema 库名, table_name 表名, index_name 索引名称, index_type 索引类型,NON_UNIQUE 是否唯一,
GROUP_CONCAT(column_name order by SEQ_IN_INDEX) 索引使用的列
FROM
information_schema.STATISTICS
where index_name = 'PRIMARY' and table_schema not in ('mysql','information_schema')
GROUP BY table_schema , table_name , index_type, index_name,NON_UNIQUE;


--检查非主键是否一致
SELECT
table_schema 库名, table_name 表名, index_name 索引名称, index_type 索引类型,NON_UNIQUE 是否唯一,
GROUP_CONCAT(column_name order by SEQ_IN_INDEX) 索引使用的列
FROM
information_schema.STATISTICS
where index_name = 'PRIMARY' and table_schema not in ('mysql','information_schema')
GROUP BY table_schema , table_name , index_type, index_name,NON_UNIQUE;

常用健康检查

主从检查

select thread_id,threads.name,sum(count_star) as totalCount, sum(sum_timer_wait) as TotalTime
from
performance_schema.events_waits_summary_by_thread_by_event_name
inner join performance_schema.threads using (thread_id)
where threads.name like 'thread/sql/slave\_%'
group by thread_id,threads.name;

Definer检查

select ROUTINE_SCHEMA,ROUTINE_NAME,DEFINER from routines;
select trigger_schema,trigger_name,definer from triggers;
select table_schema,table_name,definer from views;

无主键的表

select table_schema,table_name from information_schema.tables where (table_schema,table_name) not in(     select distinct table_schema,table_name from information_schema.columns where COLUMN_KEY='PRI'  ) and  table_schema not in ('mysql','performance_schema','information_schema','booboo') and table_type='BASE TABLE'
and table_name not like 'pm_%' and table_name not like 'cloudods_moni%';

全表扫描的SQL

SELECT
*
FROM
(SELECT
(DIGEST_TEXT) AS query, # SQL语句
SCHEMA_NAME AS db, # 数据库
IF(SUM_NO_GOOD_INDEX_USED > 0
OR SUM_NO_INDEX_USED > 0, '*', '') AS full_scan, # 全表扫描总数
COUNT_STAR AS exec_count, # 事件总计
SUM_ERRORS AS err_count, # 错误总计
SUM_WARNINGS AS warn_count, # 警告总计
(SUM_TIMER_WAIT) AS total_latency, # 总的等待时间
(MAX_TIMER_WAIT) AS max_latency, # 最大等待时间
(AVG_TIMER_WAIT) AS avg_latency, # 平均等待时间
(SUM_LOCK_TIME) AS lock_latency, # 锁时间总时长
FORMAT(SUM_ROWS_SENT, 0) AS rows_sent, # 总返回行数
ROUND(IFNULL(SUM_ROWS_SENT / NULLIF(COUNT_STAR, 0), 0)) AS rows_sent_avg, # 平均返回行数
SUM_ROWS_EXAMINED AS rows_examined, # 总扫描行数
ROUND(IFNULL(SUM_ROWS_EXAMINED / NULLIF(COUNT_STAR, 0), 0)) AS rows_examined_avg, # 平均扫描行数
SUM_CREATED_TMP_TABLES AS tmp_tables, # 创建临时表的总数
SUM_CREATED_TMP_DISK_TABLES AS tmp_disk_tables, # 创建磁盘临时表的总数
SUM_SORT_ROWS AS rows_sorted, # 排序总行数
SUM_SORT_MERGE_PASSES AS sort_merge_passes, # 归并排序总行数
DIGEST AS digest, # 对SQL_TEXT做MD5产生的32位字符串
FIRST_SEEN AS first_seen, # 第一次执行时间
LAST_SEEN AS last_seen # 最后一次执行时间
FROM
performance_schema.events_statements_summary_by_digest d) t1
WHERE
t1.full_scan = '*'
ORDER BY t1.total_latency DESC
LIMIT 5;

创建大量临时表的SQL

SELECT
*
FROM
(SELECT
(DIGEST_TEXT) AS query, # SQL语句
SCHEMA_NAME AS db, # 数据库
IF(SUM_NO_GOOD_INDEX_USED > 0
OR SUM_NO_INDEX_USED > 0, '*', '') AS full_scan, # 全表扫描总数
COUNT_STAR AS exec_count, # 事件总计
SUM_ERRORS AS err_count, # 错误总计
SUM_WARNINGS AS warn_count, # 警告总计
(SUM_TIMER_WAIT) AS total_latency, # 总的等待时间
(MAX_TIMER_WAIT) AS max_latency, # 最大等待时间
(AVG_TIMER_WAIT) AS avg_latency, # 平均等待时间
(SUM_LOCK_TIME) AS lock_latency, # 锁时间总时长
FORMAT(SUM_ROWS_SENT, 0) AS rows_sent, # 总返回行数
ROUND(IFNULL(SUM_ROWS_SENT / NULLIF(COUNT_STAR, 0), 0)) AS rows_sent_avg, # 平均返回行数
SUM_ROWS_EXAMINED AS rows_examined, # 总扫描行数
ROUND(IFNULL(SUM_ROWS_EXAMINED / NULLIF(COUNT_STAR, 0), 0)) AS rows_examined_avg, # 平均扫描行数
SUM_CREATED_TMP_TABLES AS tmp_tables, # 创建临时表的总数
SUM_CREATED_TMP_DISK_TABLES AS tmp_disk_tables, # 创建磁盘临时表的总数
SUM_SORT_ROWS AS rows_sorted, # 排序总行数
SUM_SORT_MERGE_PASSES AS sort_merge_passes, # 归并排序总行数
DIGEST AS digest, # 对SQL_TEXT做MD5产生的32位字符串
FIRST_SEEN AS first_seen, # 第一次执行时间
LAST_SEEN AS last_seen # 最后一次执行时间
FROM
performance_schema.events_statements_summary_by_digest d) t1
ORDER BY t1.tmp_disk_tables DESC
LIMIT 5;

大表(单表行数大于500w,且平均行长大于10KB)

SELECT
t.table_name 表,
t.table_schema 库,
t.engine 引擎,
t.table_length_B 表空间, #单位 Bytes
t.table_length_B/t1.all_length_B 表空间占比,
t.data_length_B 数据空间, #单位 Bytes
t.index_length_B 索引空间, #单位 Bytes
t.table_rows 行数,
t.avg_row_length_B 平均行长KB
FROM
(
SELECT
table_name,
table_schema,
ENGINE,
table_rows,
data_length + index_length AS table_length_B,
data_length AS data_length_B,
index_length AS index_length_B,
AVG_ROW_LENGTH AS avg_row_length_B
FROM
information_schema.tables
WHERE
table_schema NOT IN ('mysql' , 'performance_schema', 'information_schema', 'sys')
) t
join (
select sum((data_length + index_length)) as all_length_B from information_schema.tables
) t1
WHERE
t.table_rows > 5000000
AND t.avg_row_length_B > 10240;

表碎片

SELECT
table_schema, # 库
table_name, # 表
(index_length + data_length) total_length, # 表空间
table_rows, # 行数
data_length, # 数据空间 单位 Bytes
index_length, # 索引空间 单位 Bytes
data_free, # 空闲空间 单位 Bytes
ROUND(data_free / (index_length + data_length),
2) rate_data_free # 表碎片
FROM
information_schema.tables
WHERE
table_schema NOT IN ('information_schema' , 'mysql', 'performance_schema', 'sys')
ORDER BY rate_data_free DESC
LIMIT 5;

热点表

SELECT
object_schema AS table_schema, # 库
object_name AS table_name, # 表
count_star AS rows_io_total, # 事件总数
count_read AS rows_read, # read次数
count_write AS rows_write, # write次数
count_fetch AS rows_fetchs, # fetch次数
count_insert AS rows_inserts, # insert次数
count_update AS rows_updates, # update次数
count_delete AS rows_deletes, # delete次数
CONCAT(ROUND(sum_timer_fetch / 3600000000000000, 2),
'h') AS fetch_latency, # fench总时间 单位 小时
CONCAT(ROUND(sum_timer_insert / 3600000000000000, 2),
'h') AS insert_latency, # insert总时间 单位 小时
CONCAT(ROUND(sum_timer_update / 3600000000000000, 2),
'h') AS update_latency, # update总时间 单位 小时
CONCAT(ROUND(sum_timer_delete / 3600000000000000, 2),
'h') AS delete_latency # delete总时间 单位 小时
FROM
performance_schema.table_io_waits_summary_by_table
ORDER BY sum_timer_wait DESC
LIMIT 5;

全表扫描的表

SELECT
object_schema, # 库
object_name, # 表
count_read AS rows_full_scanned #全表扫描的行数
FROM
performance_schema.table_io_waits_summary_by_index_usage
WHERE
index_name IS NULL AND count_read > 0
ORDER BY count_read DESC
LIMIT 5;

未使用的索引

SELECT
object_schema, # 库
object_name, # 表
index_name # 索引名
FROM
performance_schema.table_io_waits_summary_by_index_usage
WHERE
index_name IS NOT NULL
AND count_star = 0
AND object_schema NOT IN ('mysql' ,'performance_schema')
AND index_name <> 'PRIMARY'
ORDER BY object_schema , object_name;

冗余索引

SELECT
a.TABLE_SCHEMA AS '数据名',
a.TABLE_NAME AS '表名',
group_concat(a.INDEX_NAME,b.INDEX_NAME) AS '重复索引',
a.COLUMN_NAME AS '重复列名'
FROM
information_schema.STATISTICS a
JOIN
information_schema.STATISTICS b ON a.TABLE_SCHEMA = b.TABLE_SCHEMA
AND a.TABLE_NAME = b.TABLE_NAME
AND a.SEQ_IN_INDEX = b.SEQ_IN_INDEX
AND a.COLUMN_NAME = b.COLUMN_NAME
WHERE
a.SEQ_IN_INDEX = 1
AND a.INDEX_NAME <> b.INDEX_NAME group by a.TABLE_SCHEMA,a.TABLE_NAME,a.COLUMN_NAME;

库空间统计

SELECT
table_schema, # 库
ROUND(SUM(data_length / 1024 / 1024), 2) AS data_length_MB, # 数据空间 单位MB
ROUND(SUM(index_length / 1024 / 1024), 2) AS index_length_MB, # 索引空间 单位MB
ROUND(SUM((data_length + index_length) / 1024 / 1024), 2) AS total_length_MB # 总空间 单位MB
FROM
information_schema.tables
GROUP BY table_schema
ORDER BY data_length_MB DESC , index_length_MB DESC;

表空间统计

SELECT
t.table_name 表,
t.table_schema 库,
t.engine 引擎,
t.table_length_B 表空间,
t.table_length_B/t1.all_length_B 表空间占比,
t.data_length_B 数据空间,
t.index_length_B 索引空间,
t.table_rows 行数,
t.avg_row_length_B 平均行长
FROM
(
SELECT
table_name,
table_schema,
ENGINE,
table_rows,
data_length + index_length AS table_length_B,
data_length AS data_length_B,
index_length AS index_length_B,
AVG_ROW_LENGTH AS avg_row_length_B
FROM
information_schema.tables
WHERE
table_schema NOT IN ('mysql' , 'performance_schema', 'information_schema', 'sys') and table_type != 'VIEW'
) t
join (
select sum((data_length + index_length)) as all_length_B from information_schema.tables
) t1;

SELECT
t.table_name 表,
t.table_schema 库,
t.engine 引擎,
t.table_length_B 表空间,
t.data_length_B 数据空间,
t.index_length_B 索引空间,
t.table_rows 行数,
t.avg_row_length_B 平均行长
FROM
(
SELECT
table_name,
table_schema,
ENGINE,
table_rows,
data_length + index_length AS table_length_B,
data_length AS data_length_B,
index_length AS index_length_B,
AVG_ROW_LENGTH AS avg_row_length_B
FROM
information_schema.tables
WHERE
table_schema IN ('cloudodscn') and table_type != 'VIEW' and table_name in ("nbrplan","nbrcurcode","nladpa","ladpj")
) t;

常用故障排查

客户端会话连接统计

mysql -uroot -p'xxx' -e "select host from information_schema.processlist" | awk -F ':' '{print $1}' | sort | uniq

查看有元锁的线程

SELECT
id, State, command
FROM
information_schema.processlist
WHERE
State = 'Waiting for table metadata lock';

生成解决元锁的语句

查询 information_schema.innodb_trx 看到有长时间未完成的事务, 使用 kill 命令终止该查询。

select concat('kill ',i.trx_mysql_thread_id,';') from information_schema.innodb_trx i,
(select
id, time
from
information_schema.processlist
where
time = (select
max(time)
from
information_schema.processlist
where
state = 'Waiting for table metadata lock'
and info regexp 'alter|optim|repai|lock|drop|creat')) p
where timestampdiff(second, i.trx_started, now()) > p.time
and i.trx_mysql_thread_id not in (connection_id(),p.id);

完整元锁检查

## 第一种情况,则定位到长时间未提交的事务kill即可

# 查询 information_schema.innodb_trx 看到有长时间未完成的事务, 使用 kill 命令终止该查询。

select concat('kill ',i.trx_mysql_thread_id,';') from information_schema.innodb_trx i,
(select
id, time
from
information_schema.processlist
where
time = (select
max(time)
from
information_schema.processlist
where
state = 'Waiting for table metadata lock'
and info regexp 'alter|optim|repai|lock|drop|creat')) p
where timestampdiff(second, i.trx_started, now()) > p.time
and i.trx_mysql_thread_id not in (connection_id(),p.id);

-- 请根据具体的情景修改查询语句
-- 如果导致阻塞的语句的用户与当前用户不同,请使用导致阻塞的语句的用户登录来终止会话

## 第二种情况,是在第一种情况的基础上,还是有metadatalock锁,则手动继续kill掉长事务即可,注意生产环境中,有可能ddl操作需要保留

select id,State,command from information_schema.processlist where State="Waiting for table metadata lock";
select timediff(sysdate(),trx_started) timediff,sysdate(),trx_started,id,USER,DB,COMMAND,STATE,trx_state,trx_query from information_schema.processlist,information_schema.innodb_trx where trx_mysql_thread_id=id;
show processlist;
select concat('kill ',trx_mysql_thread_id,';') from information_schema.processlist,information_schema.innodb_trx where trx_mysql_thread_id=id and State!="Waiting for table metadata lock";


## 第三种情况没有发现长时间未提交的事务,但是会话中有metadatalock


select id,State,command from information_schema.processlist where State="Waiting for table metadata lock";
select timediff(sysdate(),trx_started) timediff,sysdate(),trx_started,id,USER,DB,COMMAND,STATE,trx_state,trx_query from information_schema.processlist,information_schema.innodb_trx where trx_mysql_thread_id=id;
select t.processlist_id,t.processlist_time,e.sql_text from performance_schema.threads t,performance_schema.events_statements_current e where t.thread_id=e.thread_id and e.SQL_TEXT like '%gai%';
--------------------------------------------------------------------------
# 用于分析查看metadatalock 锁的第三中情况的细节问题

select * from performance_schema.mutex_instances where LOCKED_BY_THREAD_ID is not null\G;


# 查看有metalock锁的线程
# 查看未提交的事务运行时间,线程id,用户等信息
# 查看未提交的事务运行时间,线程id,用户,sql语句等信息
# 查看错误语句
# 根据错误语句的THREAD_ID,查看PROCESSLIST_ID

select id,State,command from information_schema.processlist where State="Waiting for table metadata lock";
select timediff(sysdate(),trx_started) timediff,sysdate(),trx_started,id,USER,DB,COMMAND,STATE,trx_state,trx_query from information_schema.processlist,information_schema.innodb_trx where trx_mysql_thread_id=id;
select timediff(sysdate(),trx_started) timediff,sysdate(),trx_started,id,USER,DB,COMMAND,STATE,trx_state from information_schema.processlist,information_schema.innodb_trx where trx_mysql_thread_id=id\G;
select * from performance_schema.events_statements_current where SQL_TEXT like '%booboo%'\G;
select * from performance_schema.threads where thread_id=46052\G;
select * from information_schema.processlist where id=xxx\G;

创建MySQL事件-自动清理长时间执行的查询

比如下面的代码会每 5 分钟清理一次当前用户运行时间超过 1 个小时且非锁等待会话。

delimiter //
create event my_long_running_query_monitor
on schedule every 5 minute
starts '2015-09-15 11:00:00'
on completion preserve enable do
begin
declare v_sql varchar(500);
declare no_more_long_running_query integer default 0;
declare c_tid cursor for
select concat ('kill ',id,';') from
information_schema.processlist
where time >= 3600
and user = substring(current_user(),1,instr(current_user(),'@')-1)
and command not in ('sleep')
and state not like ('waiting for table%lock');
declare continue handler for not found
set no_more_long_running_query=1;
open c_tid;
repeat
fetch c_tid into v_sql;
set @v_sql=v_sql;
prepare stmt from @v_sql;
execute stmt;
deallocate prepare stmt;
until no_more_long_running_query end repeat;
close c_tid;
end;//
delimiter ;

查看InnoDB未提交的事务信息

SELECT
TIMEDIFF(SYSDATE(), trx_started) timediff,
SYSDATE(),
trx_started,
id,
USER,
DB,
COMMAND,
STATE,
trx_state,
trx_query
FROM
information_schema.processlist,
information_schema.innodb_trx
WHERE
trx_mysql_thread_id = id;

查看InnoDB事务锁冲突

SELECT
blocking_trx_id, COUNT(blocking_trx_id) AS countnum
FROM
(SELECT
a.trx_id,
a.trx_state,
b.requesting_trx_id,
b.blocking_trx_id
FROM
information_schema.innodb_lock_waits AS b
LEFT JOIN information_schema.innodb_trx AS a ON a.trx_id = b.requesting_trx_id) AS t1
GROUP BY blocking_trx_id
ORDER BY countnum DESC;

select t1.blocking_trx_id,t1.countnum,t3.* from
(SELECT
blocking_trx_id, COUNT(*) AS countnum
FROM
(SELECT
a.trx_id,
a.trx_state,
b.requesting_trx_id,
b.blocking_trx_id
FROM
information_schema.innodb_lock_waits AS b
LEFT JOIN information_schema.innodb_trx AS a ON a.trx_id = b.requesting_trx_id) AS t1
GROUP BY blocking_trx_id
ORDER BY countnum DESC
) t1
join information_schema.innodb_trx t2
on t1.blocking_trx_id = t2.trx_id
join information_schema.processlist t3
on t2.trx_mysql_thread_id=t3.id;

获取到InnoDB事务锁冲突的原始id

SELECT
id
FROM
information_schema.processlist,
information_schema.innodb_trx
WHERE
trx_mysql_thread_id = id
AND trx_id IN (SELECT
blocking_trx_id
FROM
(SELECT
blocking_trx_id, COUNT(blocking_trx_id) AS countnum
FROM
(SELECT
a.trx_id,
a.trx_state,
b.requesting_trx_id,
b.blocking_trx_id
FROM
information_schema.innodb_lock_waits AS b
LEFT JOIN information_schema.innodb_trx AS a ON a.trx_id = b.requesting_trx_id) AS t1
GROUP BY blocking_trx_id
ORDER BY countnum DESC
LIMIT 1) c);

MySQL Binglog

查看当前二进制日志

show master status\G;

查看所有的binlog文件名和文件大小

show binary logs;
show master logs;

查看binlog日志中具体的事件

show binlog events in 'mastera.000005' from 219 limit 3;

字符集相关

查看支持的字符编码和校验集信息

show character set;
show character set like 'utf%';
show collation;
show collation like 'utf8%'

检查库的字符集和字符校验规则

SELECT DEFAULT_CHARACTER_SET_NAME, DEFAULT_COLLATION_NAME FROM information_schema.SCHEMATA S
WHERE schema_name = 'confluence_vpc'
AND
(
DEFAULT_CHARACTER_SET_NAME != 'utf8'
OR
DEFAULT_COLLATION_NAME != 'utf8_bin'
);

检查表的字符集和字符校验规则

SELECT T.TABLE_NAME, C.CHARACTER_SET_NAME, C.COLLATION_NAME
FROM information_schema.TABLES AS T, information_schema.COLLATION_CHARACTER_SET_APPLICABILITY AS C
WHERE C.collation_name = T.table_collation
AND T.table_schema = 'confluence_vpc'
AND
(
C.CHARACTER_SET_NAME != 'utf8'
OR
C.COLLATION_NAME != 'utf8_bin'
);

检查列的字符集和字符校验规则

SELECT TABLE_NAME, COLUMN_NAME, CHARACTER_SET_NAME, COLLATION_NAME
FROM information_schema.COLUMNS
WHERE TABLE_SCHEMA = 'confluence_vpc'
AND
(
CHARACTER_SET_NAME != 'utf8'
OR
COLLATION_NAME != 'utf8_bin'
);

修改列的字符校验规则

SELECT CONCAT('ALTER TABLE `', table_name, '` MODIFY `', column_name, '` ', DATA_TYPE, '(', CHARACTER_MAXIMUM_LENGTH, ') CHARACTER SET UTF8 COLLATE utf8_bin', (CASE WHEN IS_NULLABLE = 'NO' THEN ' NOT NULL' ELSE '' END), ';')
FROM information_schema.COLUMNS
WHERE TABLE_SCHEMA = 'confluence_vpc'
AND
(
CHARACTER_SET_NAME != 'utf8'
OR
COLLATION_NAME != 'utf8_bin'
);

会话查询

属于某个库的会话

select id from information_schema.processlist where db='ecshoptest';

执行命令为sleep的会话

select id from information_schema.processlist where command='sleep';

执行命令为query的会话

select id from information_schema.processlist where command='query';

会话时间超过多少秒的的

select id from information_schema.processlist where time>5000;

找到某个库中事务状态为lock的会话id

select id from information_schema.processlist,information_schema.innodb_trx where trx_mysql_thread_id=id and trx_state like 'LOCK%' and db='ecshoptest';

所有的会话id

select id from information_schema.processlist;

属于某个用户的会话

select id from information_schema.processlist where user='yaoli';

Kill Session

kill_long_session

#!/bin/bash
# kill掉 指定数据库kyh中超过1分钟的会话id,暴力,用于CPU持续飙高,临时解决问题
user=
password=
host=
port=

# processlist snapshot
mysql -u$user -p$password -h$host -P$port -e "select concat('kill ',id,';'),'KYHINFO',now(),id,user,host,db,command,time,state,info from information_schema.processlist where db='kyh' and time > 60" > tmpfile

# save
cat tmpfile >> processlist_history.log

# kill
awk -F 'KYHINFO' '{if (NR != 1) print $1 }' tmpfile | mysql -u$user -p$password -h$host -P$port

kill_all_session

#!/bin/bash
# kill掉 数据库中所有的会话id,暴力,用于CPU持续飙高,临时解决问题
user=
password=
host=
port=


mysql -u$user -p$password -h$host -P$port -e "select concat('kill ',id,';') from information_schema.processlist" > tmpfile

awk '{if (NR != 1) print $0 }' tmpfile | mysql -u$user -p$password -h$host -P$port

kill_databases_session

#!/bin/bash
# kill掉 指定数据库中所有的会话id,暴力,用于CPU持续飙高,临时解决问题
user=
password=
host=
port=


mysql -u$user -p$password -h$host -P$port -e "select concat('kill ',id,';') from information_schema.processlist where db in ("dbname","dbname2") > tmpfile

awk '{if (NR != 1) print $0 }' tmpfile | mysql -u$user -p$password -h$host -P$port

kille_blocking_trx_id

#!/bin/bash
# kill掉 ecshoptest库中的导致lock wait会话id
user=
password=
host=
port=

mysql -u$user -p$password -h$host -P$port -e "select concat('kill ',id,';') from information_schema.processlist,information_schema.innodb_trx where trx_mysql_thread_id=id and trx_id in (select blocking_trx_id from (select blocking_trx_id, count(blocking_trx_id) as countnum from (select a.trx_id,a.trx_state,b.requesting_trx_id,b.blocking_trx_id from information_schema.innodb_lock_waits as b left join information_schema.innodb_trx as a on a.trx_id=b.requesting_trx_id) as t1 group by blocking_trx_id order by countnum desc limit 1) c) ;" > tmpfile

awk '{if (NR != 1) print $0 }' tmpfile | mysql -u$user -p$password -h$host -P$port

forget_password

#!/bin/bash
# mysql的root密码不停服务破解方式 支持5.5 5.6 5.7

user=booboo
password="(Uploo00king)"
host=localhost
port=3306
datadir="/alidata/mysql/data"
database="cloudcare"
dbdir=${datadir}/${database}
echo ${dbdir}
rootpwd='(Uploo00king)'


# linux系统内的操作,拷贝mysql下的用户表,到cloudcare库下
\cp -avx ${datadir}/mysql/user.* ${dbdir}

# 登陆低权限用户连接mysql,修改root密码
echo "update ${database}.user set authentication_string=password('${rootpwd}') where user='root';" | mysql -u$user -p$password -h$host -P$port $database

# 拷贝更改后的user表到mysql库下
\cp -avx ${dbdir}/user.* ${datadir}/mysql/

# 查找mysqld的父进程
mysqld_pid=`pgrep -n mysqld`

# 向mysqld发送SIGHUP信号,强制刷新
kill -SIGHUP ${mysqld_pid}

# ok 牢记密码即可
echo "root password is $rootpwd , Please remember the password!!! "

参数查询

内存查看

show variables where variable_name in (
'innodb_buffer_pool_size','innodb_log_buffer_size','innodb_additional_mem_pool_size','key_buffer_size','query_cache_size');

# session私有内存
mysql>show variables where variable_name in (
'read_buffer_size','read_rnd_buffer_size','sort_buffer_size','join_buffer_size','binlog_cache_size','tmp_table_size');

慢查询参数查询

SELECT  
'slow_query_log' as parameter,
@@slow_query_log as value, '慢查询日志开启状态' as info
UNION
SELECT
'long_query_time',
@@long_query_time, '慢查询阈值'
UNION
SELECT
'log_output',
@@log_output,
'慢查询保存方式'
UNION
SELECT
'slow_query_log_file',
@@slow_query_log_file, '慢查询日志文件'
UNION
SELECT
'log_queries_not_using_indexes',
@@log_queries_not_using_indexes,
'未使用索引查询是否记录'
UNION
SELECT
'log_slow_admin_statements',
@@log_slow_admin_statements,
'是否将慢管理语句包含例如analyze';

其他命令

查看存储引擎的状态

show engine innodb status\G;

SHOW ENGINE engine_name {STATUS | MUTEX}
SHOW [STORAGE] ENGINES
SHOW ERRORS [LIMIT [offset,] row_count]
SHOW EVENTS
SHOW FUNCTION CODE func_name
SHOW FUNCTION STATUS [like_or_where]
SHOW GRANTS FOR user
SHOW INDEX FROM tbl_name [FROM db_name]
SHOW MASTER STATUS
SHOW OPEN TABLES [FROM db_name] [like_or_where]
SHOW PLUGINS
SHOW PROCEDURE CODE proc_name
SHOW PROCEDURE STATUS [like_or_where]
SHOW PRIVILEGES
SHOW [FULL] PROCESSLIST
SHOW PROFILE [types] [FOR QUERY n] [OFFSET n] [LIMIT n]
SHOW PROFILES
SHOW RELAYLOG EVENTS [IN 'log_name'] [FROM pos] [LIMIT [offset,] row_count]
SHOW SLAVE HOSTS
SHOW SLAVE STATUS [NONBLOCKING]
SHOW [GLOBAL | SESSION] STATUS [like_or_where]
SHOW TABLE STATUS [FROM db_name] [like_or_where]
SHOW [FULL] TABLES [FROM db_name] [like_or_where]
SHOW TRIGGERS [FROM db_name] [like_or_where]
SHOW [GLOBAL | SESSION] VARIABLES [like_or_where]
SHOW WARNINGS [LIMIT [offset,] row_count]

like_or_where:
LIKE 'pattern'
| WHERE expr

查看库名

show databases like 'mysql'

查看对象

(库、表、函数、存储过程、表、触发器、视图)信息

SHOW CREATE DATABASE db_name
SHOW CREATE EVENT event_name
SHOW CREATE FUNCTION func_name
SHOW CREATE PROCEDURE proc_name
SHOW CREATE TABLE tbl_name
SHOW CREATE TRIGGER trigger_name
SHOW CREATE VIEW view_name

抓包工具

# 获取来源于某个ip的服务器与3306的通信情况
tcpdump -w tcp.out port 3306 and src 10.197.0.181
strings tcp.out > tcp.txt

RDS逻辑备份恢复预处理

#!/bin/bash
sed -e 's/DEFINER[ ]*=[ ]*[^*]*\*/\*/ ' $1 > tmp.sql
awk '{ if (index($0,"GTID_PURGED")) { getline; while (length($0) > 0) { getline; } } else { print $0 } }' tmp.sql | grep -iv 'set @@' > retmp.sql
egrep -in "definer|set @@" your_revised.sql

大表优化思路

  • 第一优化sql和索引;
  • 第二加缓存,memcached,redis;
  • 第三以上都做了后,还是慢,就做主从复制或主主复制,读写分离,可以在应用层做,效率高,也可以用三方工具,例如360的atlas等;
  • 第四如果以上都做了还是慢,使用mysql自带的分区表;
  • 第五如果以上都做了,那就先做垂直拆分,根据你模块的耦合度,将一个大的系统分为多个小的系统,也就是分布式系统;
  • 第六才是水平切分,针对数据量大的表,这一步最麻烦,最能考验技术水平,要选择一个合理的sharding key,为了有好的查询效率,表结构也要改动,做一定的冗余,应用也要改,sql中尽量带sharding key,将数据定位到限定的表上去查,而不是扫描全部的表;

其他命令

# 查看具体cpu 线程占用情况
ps -mp 2289 -o THREAD,tid,time
# 找到耗时最高的线程TID,并将其线程ID转换为16进制格式:
printf "%x\n" tid
# 打印线程的堆栈信息,thread dump
jstack pid |grep tid -A 30

## 元锁
select * from information_schema.processlist where State='Waiting for table metadata lock';
select a.count, b.id
from
(select count(*) count from information_schema.processlist where State='Waiting for table metadata lock') a
join
(
select max(id) id from
(select i.trx_mysql_thread_id id from information_schema.innodb_trx i,
(select
id, time
from
information_schema.processlist
where
time = (select
max(time)
from
information_schema.processlist
where
state = 'Waiting for table metadata lock'
and substring(info, 1, 5) in ('alter' , 'optim', 'repai', 'lock ', 'drop ', 'creat'))) p
where timestampdiff(second, i.trx_started, now()) > p.time
and i.trx_mysql_thread_id not in (connection_id(),p.id)
union select 0 id) t1
)b;

select i.trx_mysql_thread_id from information_schema.innodb_trx i,
(select
id, time
from
information_schema.processlist
where
time = (select
max(time)
from
information_schema.processlist
where
state = 'Waiting for table metadata lock'
and substring(info, 1, 5) in ('alter' , 'optim', 'repai', 'lock ', 'drop ', 'creat'))) p
where timestampdiff(second, i.trx_started, now()) > p.time
and i.trx_mysql_thread_id not in (connection_id(),p.id);

## 行锁

SELECT
a1.ID,
a1.USER,
a1.HOST,
a1.DB,
a1.COMMAND,
a1.TIME,
a1.STATE,
IFNULL(a1.INFO, '') INFO,
a3.trx_id,
a3.trx_state,
unix_timestamp(a3.trx_started) trx_started,
IFNULL(a3.trx_requested_lock_id, '') trx_requested_lock_id,
IFNULL(a3.trx_wait_started, '') trx_wait_started,
a3.trx_weight,
a3.trx_mysql_thread_id,
IFNULL(a3.trx_query, '') trx_query,
IFNULL(a3.trx_operation_state, '') trx_operation_state,
a3.trx_tables_in_use,
a3.trx_tables_locked,
a3.trx_lock_structs,
a3.trx_lock_memory_bytes,
a3.trx_rows_locked,
a3.trx_rows_modified,
a3.trx_concurrency_tickets,
a3.trx_isolation_level,
a3.trx_unique_checks,
IFNULL(a3.trx_foreign_key_checks, '') trx_foreign_key_checks,
IFNULL(a3.trx_last_foreign_key_error, '') trx_last_foreign_key_error,
a3.trx_adaptive_hash_latched,
a3.trx_adaptive_hash_timeout,
a3.trx_is_read_only,
a3.trx_autocommit_non_locking,
a2.countnum
FROM
(SELECT
min_blocking_trx_id AS blocking_trx_id,
COUNT(trx_mysql_thread_id) countnum
FROM
(SELECT
trx_mysql_thread_id,
MIN(blocking_trx_id) AS min_blocking_trx_id
FROM
(SELECT
a.trx_id,
a.trx_state,
b.requesting_trx_id,
b.blocking_trx_id,
a.trx_mysql_thread_id
FROM
information_schema.innodb_lock_waits AS b
LEFT JOIN information_schema.innodb_trx AS a ON a.trx_id = b.requesting_trx_id) AS t1
GROUP BY trx_mysql_thread_id
ORDER BY min_blocking_trx_id) c
GROUP BY min_blocking_trx_id) a2
JOIN
information_schema.innodb_trx a3 ON a2.blocking_trx_id = a3.trx_id
JOIN
information_schema.processlist a1 ON a1.id = a3.trx_mysql_thread_id;

select * from information_schema.innodb_locks;


# 总核数 = 物理CPU个数 X 每颗物理CPU的核数
# 总逻辑CPU数 = 物理CPU个数 X 每颗物理CPU的核数 X 超线程数

# 查看物理CPU个数
cat /proc/cpuinfo| grep "physical id"| sort| uniq| wc -l

# 查看每个物理CPU中core的个数(即核数)
cat /proc/cpuinfo| grep "cpu cores"| uniq

# 查看逻辑CPU的个数
cat /proc/cpuinfo| grep "processor"| wc -l

SELECT table_name,table_rows,data_length,index_length,(data_length+index_length) data FROM information_schema.tables where table_schema='vingoo_ms' ;
select sum(total_GB) total_GB
from
(select sum(data_length_GB) total_GB from (select table_name,
(round(data_length/1024/1024/1024,2) + round(index_length/1024/1024/1024,2) )as data_length_GB
from information_schema.`tables` where table_schema = "vingoo_ms") t1)t2;


vmstat 1 5
iostat -dkx 1 5
netstat -nat | awk '{print $6}'| sort | uniq -c
netstat -na | grep ESTABLISHED|awk '{print $5}' | awk -F: '{print $1}' | sort|uniq -c
# CPU Top 5
ps -aux 2> /dev/null | sort -k3nr | head -n 5 | awk 'BEGIN{print "%CPU\tPID\tCOMMAD"}{print $3,'\t',$2,'\t',$11}'
# MEM Top 5
ps -aux 2> /dev/null | sort -k4nr | head -n 5 | awk 'BEGIN{print "%MEM\tPID\tCOMMAD"}{print $4,'\t',$2,'\t',$11}'


select version();
show global status like 'Uptime';
show global status like 'Questions';
show global status like 'Threads_connected';


select table_schema,round(sum(data_length/1024/1024),2) as data_length_MB,
round(sum(index_length/1024/1024),2) as index_length_MB
from information_schema.tables
group by table_schema order by data_length_MB desc,index_length_MB desc;

select table_schema,table_name,table_rows,round(data_length/1024/1024,2) as data_length_MB,
round(index_length/1024/1024,2) as index_length_MB
from information_schema.tables
where table_schema = and table_name in ();


select table_schema,table_name, TABLE_ROWS,
round(data_length/1024/1024,2) as data_length_MB,
round(index_length/1024/1024,2) as index_length_MB
from information_schema.tables
order by data_length_MB desc,index_length_MB desc
limit 10;

select count(table_name) table_count from information_schema.tables
WHERE table_type = 'BASE TABLE';


SELECT table_type ,engine,COUNT(TABLE_NAME) AS num_tables
FROM INFORMATION_SCHEMA.TABLES
group by TABLE_TYPE,engine order by num_tables desc;


SELECT
ROUND(((data_size + index_size) / gb),4) AS total_size_gb,
ROUND((index_size / gb),4) AS index_size_gb,
ROUND((data_size / gb),4) AS data_size_gb,
ROUND((index_size / (data_size + index_size)),2) * 100 AS perc_index,
ROUND((data_size / (data_size + index_size)),2) * 100 AS perc_data
FROM (
SELECT
SUM(data_length) data_size,
SUM(index_length) index_size,
SUM(if(engine = 'innodb', data_length, 0)) AS innodb_data_size,
SUM(if(engine = 'innodb', index_length, 0)) AS innodb_index_size,
SUM(if(engine = 'myisam', data_length, 0)) AS myisam_data_size,
SUM(if(engine = 'myisam', index_length, 0)) AS myisam_index_size,
POW(1024, 3) gb
FROM information_schema.tables
WHERE table_type = 'BASE TABLE') a;


SELECT
ROUND((SUM(innodb_index_size + innodb_data_size) / gb),4) AS innodb_total_size_gb,
ROUND((innodb_data_size / gb),4) AS innodb_data_size_gb,
ROUND((innodb_index_size / gb),4) AS innodb_index_size_gb,
ROUND(innodb_index_size / (innodb_data_size + innodb_index_size),2) * 100 AS innodb_perc_index,
ROUND(innodb_data_size / (innodb_data_size + innodb_index_size),2) * 100 AS innodb_perc_data,
ROUND(innodb_index_size / index_size,2) * 100 AS innodb_perc_total_index,
ROUND(innodb_data_size / data_size,2) * 100 AS innodb_perc_total_data
FROM (
SELECT
SUM(data_length) data_size,
SUM(index_length) index_size,
SUM(if(engine = 'innodb', data_length, 0)) AS innodb_data_size,
SUM(if(engine = 'innodb', index_length, 0)) AS innodb_index_size,
SUM(if(engine = 'myisam', data_length, 0)) AS myisam_data_size,
SUM(if(engine = 'myisam', index_length, 0)) AS myisam_index_size,
POW(1024, 3) gb
FROM information_schema.tables
WHERE table_type = 'BASE TABLE') a;


SELECT
ROUND((SUM(myisam_index_size + myisam_data_size) / gb),4) AS myisam_total_size_gb,
ROUND((myisam_data_size / gb),4) AS myisam_data_size_gb,
ROUND((myisam_index_size / gb),4) AS myisam_index_size_gb,
ROUND(myisam_index_size / (myisam_data_size + myisam_index_size),2) * 100 AS myisam_perc_index,
ROUND(myisam_data_size / (myisam_data_size + myisam_index_size),2) * 100 AS myisam_perc_data,
ROUND(myisam_index_size / index_size,2) * 100 AS myisam_perc_total_index,
ROUND(myisam_data_size / data_size,2) * 100 AS myisam_perc_total_data
FROM (
SELECT
SUM(data_length) data_size,
SUM(index_length) index_size,
SUM(if(engine = 'innodb', data_length, 0)) AS innodb_data_size,
SUM(if(engine = 'innodb', index_length, 0)) AS innodb_index_size,
SUM(if(engine = 'myisam', data_length, 0)) AS myisam_data_size,
SUM(if(engine = 'myisam', index_length, 0)) AS myisam_index_size,
POW(1024, 3) gb
FROM information_schema.tables
WHERE table_type = 'BASE TABLE') a;


# 生成查询语句中的列
[root@toberoot ~]# mysql -e "select column_name from information_schema.columns where table_name='vg_sales_alipay';" | awk '{if (NR>1){a=$1;printf("%s,\n", $1)}}'
trade_no_vingoo,
trade_no_alipay,
brand_id,
trade_type,
trade_status,
total_fee,
price,
amount,
refund_fee,
refund_status,
refund_times,
refund_date,
refund_type,
refund_desc,
refund_op,
trade_subject,
trade_body,
gmt_create,
gmt_payment,
buyer_email,
buyer_id,
date_add,
apply_re_fee,
apply_re_desc,
apply_re_op,
apply_re_tag,
apply_re_date,

生成测试数据

CREATE TABLE t1(   
id int primary key auto_increment,
uname varchar(20) ,
ucreatetime datetime ,
age int(11)) DEFAULT CHARACTER SET=utf8 COLLATE=utf8_general_ci;

delimiter $$

create procedure test1()
begin

declare v_cnt decimal (10) default 0 ;
start transaction;
dd:loop
insert into t1 values
(null,'用户1',sysdate(),20),
(null,'用户2',sysdate(),20),
(null,'用户3',sysdate(),20),
(null,'用户4',sysdate(),20),
(null,'用户5',sysdate(),20),
(null,'用户6',sysdate(),20),
(null,'用户7',sysdate(),20),
(null,'用户8',sysdate(),20),
(null,'用户9',sysdate(),20),
(null,'用户0',sysdate(),20)
;
set v_cnt = v_cnt+10 ;
if v_cnt = 100000 then leave dd;
end if;
end loop dd ;
commit;
end $$

delimiter ;
call test1();

索引

创建的索引默认是BTREE

索引相关命令集合

利用alter命令修改id列为自增主键列:alter table student change id id int primary key auto_increment;

删除主键索引:alter table student drop primary key;

创建普通索引:alter table student add index index_dept(dept);

根据列的前n个字符创建索引:alter table student add index index_dept(dept(8)); create index index_dept on student(dept(8));

根据多个列创建联合索引create index index_name_dept on student(name,dept);

删除普通索引:alter table student drop index index_name;drop index index_name_dept on student;

创建唯一索引(非主键):create unique index uni_ind_name on student(name);

基本索引条件

  1. 要在表的列上创建索引。
  2. 索引会加快查询速度,但频繁更新需要维护索引,影响更新速度。
  3. 索引不是越多越好,要在频繁查询的where后的条件列上创建索引。
  4. 小表或唯一值极少的列上不建立索引,要在大表以及唯一值多的列上创建索引。

避免过度使用索引

  • 索引的建立对提高检索能力很有用,但是数据库维护它也很费资源
  • 对性别列(或状态列)索引,被称为过度索引;只有两个值,建立索引不仅没优势,还会影响到插入、更新速度。
  • 索引会占用磁盘空间,降低更新操作性能。
  • 索引不是越多越好,索引过多,执行计划要考虑使用哪个索引
  • 行数比较少的表可以不建索引(100行以内)

SQL执行计划

①使用explain命令查看sql语句的执行情况(是否走索引)

mysql> explain select * from test where name='oldgirl'\G;
*************************** 1. row ***************************
id: 1
select_type: SIMPLE
table: test
type: ALL
possible_keys: NULL 从查看的结果看出,查询的时候没有走索引
key: NULL
key_len: NULL
ref: NULL
rows: 4 总结查询了4
Extra: Using where
1 row in set (0.00 sec)

②SQL优化后的测试,explain命令不走缓存测试

mysql> explain SQL_NO_CACHE select * from test where name='oldgirl'\G;

③查看表的索引:

mysql> show index from 表名\G

④查建表的语句(可以看索引及创建表的相关信息)

show create table 表名\G

⑤查是不是authorid列内容不同的列,越大建立索引效果越好(查看唯一值的数量)

select count(distinct authorid) from 表名;
select count(authorid) from 表名;
select count(*) from 表名; #<--查看整个表的列的总数是多少

MySQL数据库使用索引的条件

①MySQL(BTREE)使用索引的比较条件:<, <=, =, >, >=, BETTWEEN, IN!= 或者<> 或者LIKE ‘xxx%’
②索引的列不包含NULL值
复合索引中只要有一列含有NULL值,那么这一列将不会使用索引。
所以在数据库设计时,不要让字段的默认值为NULL
③列类型是字符串,要在where条件中把字符串值用引号括起来
④用or分割开的条件,or前条件有索引,而后面列无索引,那么设计的索引都不会被用到
⑤条件不是索引列的第一部分。key(a,b)…where b=5 will not use index
⑥like语句操作
一般情况下尽量不适用like操作。like “%aaa%” 不会使用索引,而like “aaa%”可以使用索引。
可以建立fulltext或者Sphinx(斯芬克司),去专门应对搜索功能,不要使用数据库去完成这种搜索。
⑦不要在列上进行计算
select from users where YEAR(adddate)<2007;将在每个行上进行计算,这将导致索引失效而进行全表扫描,因此我们可以改成select from users where adddate<’2007-01-01’;
⑧不使用NOT IN和<>操作
NOT IN 和<>操作都不会使用索引,将进行全表扫描。NOT IN可以NOT EXISTS代替,id<>3则可使用id>3 or id<3来代替
其它:尽量用连接查询代替子查询(嵌套查询)
⑨Order by的索引问题
mysql查询只是用一个索引,因此如果where子句中已经使用了索引,order by中的列就不会再使用索引。因此数据库默认排序可以符合要求的情况下不要使用排序操作;尽量不要包含多个列的排序,如果需要最好给这些列创建复合索引。

相关的系统视图

# 索引存放在statistics
# 表存放在tables
# 列存放在columns


select table_schema,table_name,index_name,index_type,column_name from STATISTICS where table_name='cm_app_case' and column_name in ('app_id','approve_rst','case_id')
union
select table_schema,table_name,index_name,index_type,column_name from STATISTICS where table_name='cm_app_consumptioninst' and column_name in ('app_id','applicant_huko_city','APPLICANT_HUKO_COUNTY','applicant_huko_province','company_city','company_province','CUR_HOME_CITY','CUR_HOME_COUNTY','CUR_HOME_PROVINCE','EDUCTION_LEVEL','leafOrg','MARITAL_STATUS','merchant_cde','src_case_id','store_cde')
union
select table_schema,table_name,index_name,index_type,column_name from STATISTICS where table_name='cm_case_survey' and column_name in ('case_id' ,'survey_result')
union
select table_schema,table_name,index_name,index_type,column_name from STATISTICS where table_name='cm_loan_monitoring' and column_name in ('APPLICATIon_NUMBER','contract_id','id','report_id')
union
select table_schema,table_name,index_name,index_type,column_name from STATISTICS where table_name='cm_loan_risklist' and column_name in ('report_id')
union
select table_schema,table_name,index_name,index_type,column_name from STATISTICS where table_name='cm_return_hit_rule_record' and column_name in ('case_id','rule_id')
union
select table_schema,table_name,index_name,index_type,column_name from STATISTICS where table_name='cm_return_visit_case' and column_name in ('app_id','case_id','create_time','customer_result_code','sales_result_code','store_result_code')
union
select table_schema,table_name,index_name,index_type,column_name from STATISTICS where table_name='fe_org_relation' and column_name in ('org_id','company_name')
union
select table_schema,table_name,index_name,index_type,column_name from STATISTICS where table_name='fe_business' and column_name in ('id')
union
select table_schema,table_name,index_name,index_type,column_name from STATISTICS where table_name='lm_account' and column_name in ('contract_id','id','status')
union
select table_schema,table_name,index_name,index_type,column_name from STATISTICS where table_name='lm_contract_history' and column_name in ('application_number','id')
union
select table_schema,table_name,index_name,index_type,column_name from STATISTICS where table_name='lm_repayment_plan' and column_name in ('contract_id','tenor')
union
select table_schema,table_name,index_name,index_type,column_name from STATISTICS where table_name='pr_code_table' and column_name in ('id','type_id');

-------------
select table_schema,table_name,index_name,index_type,column_name from STATISTICS where (table_name='cm_app_case' and column_name in ('app_id','approve_rst','case_id')) or (table_name='cm_app_consumptioninst' and column_name in ('app_id','applicant_huko_city','APPLICANT_HUKO_COUNTY','applicant_huko_province','company_city','company_province','CUR_HOME_CITY','CUR_HOME_COUNTY','CUR_HOME_PROVINCE','EDUCTION_LEVEL','leafOrg','MARITAL_STATUS','merchant_cde','src_case_id','store_cde')) or
(table_name='cm_case_survey' and column_name in ('case_id' ,'survey_result')) or
(table_name='cm_loan_monitoring' and column_name in ('APPLICATIon_NUMBER','contract_id','id','report_id')) or
(table_name='cm_loan_risklist' and column_name in ('report_id')) or
(table_name='cm_return_hit_rule_record' and column_name in ('case_id','rule_id')) or
(table_name='cm_return_visit_case' and column_name in ('app_id','case_id','create_time','customer_result_code','sales_result_code','store_result_code')) or
(table_name='fe_org_relation' and column_name in ('org_id','company_name') ) or
(table_name='fe_business' and column_name in ('id')) or
(table_name='lm_account' and column_name in ('contract_id','id','status')) or
(table_name='lm_contract_history' and column_name in ('application_number','id')) or
(table_name='lm_repayment_plan' and column_name in ('contract_id','tenor')) or
(table_name='pr_code_table' and column_name in ('id','type_id'));
-----------------------------
--------------------------

select table_schema,table_name,column_name from columns where table_name='cm_app_consumptioninst' and column_name in ('applicant_huko_city','APPLICANT_HUKO_COUNTY','applicant_huko_province','company_city','company_province','CUR_HOME_CITY','CUR_HOME_COUNTY','CUR_HOME_PROVINCE','EDUCTION_LEVEL','leafOrg','MARITAL_STATUS')
union
select table_schema,table_name,column_name from columns where table_name='cm_case_survey' and column_name in ('survey_result')
union
select table_schema,table_name,column_name from columns where table_name='cm_loan_monitoring' and column_name in ('APPLICATIon_NUMBER','contract_id')
union
select table_schema,table_name,column_name from columns where table_name='cm_return_hit_rule_record' and column_name in ('rule_id')
union
select table_schema,table_name,column_name from columns where table_name='cm_return_visit_case' and column_name in ('create_time','customer_result_code','sales_result_code','store_result_code')
union
select table_schema,table_name,column_name from columns where table_name='fe_org_relation' and column_name in ('company_name');

报告权限

grant select on `mysql`.* to zyreport@'%' identified by 'xxx';
grant select on `performance_schema`.* to zyreport@'%' identified by 'xxx';
grant replication client on *.* to report@'%' identified by 'xxx';
flush privileges;

SQL开发军规

写在前面的话:
总是在灾难发生后,才想起容灾的重要性;
总是在吃过亏后,才记得曾经有人提醒过。
(一)核心军规
(1)不在数据库做运算
cpu计算务必移至业务层;
(2)控制单表数据量
int型不超过1000w,含char则不超过500w;
合理分表;
限制单库表数量在300以内;
(3)控制列数量
字段少而精,字段数建议在20以内;
(4)平衡范式与冗余
效率优先;
往往牺牲范式;
(5)拒绝3B
拒绝大sql语句:big sql
拒绝大事物:big transaction
拒绝大批量:big batch

(二)字段类军规
(6)用好数值类型
tinyint(1Byte)
smallint(2Byte)
mediumint(3Byte)
int(4Byte)
bigint(8Byte)
bad caseint(1)/int(11)
(7)字符转化为数字
int而不是char(15)存储ip
(8)优先使用enum或set
例如:`sex` enum (‘F’, ‘M’)
(9)避免使用NULL字段
NULL字段很难查询优化;
NULL字段的索引需要额外空间;
NULL字段的复合索引无效;
bad case
`name` char(32) default null
`age` int not null
good case
`age` int not null default 0
(10)少用text/blob
varchar的性能会比text高很多;
实在避免不了blob,请拆表;
(11)不在数据库里存图片
这个我不能理解!
但这是赶集网的经验,求detail!

(三)索引类军规
(12)谨慎合理使用索引
改善查询、减慢更新;
索引一定不是越多越好(能不加就不加,要加的一定得加);
覆盖记录条数过多不适合建索引,例如“性别”;
(13)字符字段必须建前缀索引
(14)不在索引做列运算
!!!不只是索引,都不能做列运算吧!!!
bad case
select id where age +1 = 10;
(15)innodb主键推荐使用自增列;
主键建立聚簇索引;
主键不应该被修改;
字符串不应该做主键;
如果不指定主键,innodb会使用唯一且非空值索引代替;
(16)不用外键
请由程序保证约束;

(四)sql类军规
(17)sql语句尽可能简单
一条sql只能在一个cpu运算;
大语句拆小语句,减少锁时间;
一条大sql可以堵死整个库;
(18)简单的事务
事务时间尽可能短;
bad case
上传图片事务
(19)避免使用trig/func
触发器、函数不用;
客户端程序取而代之;
(20)不用select *
消耗cpu,io,内存,带宽;
这种程序不具有扩展性;
(21)OR改写为IN()
or的效率是n级别;
in的消息时log(n)级别;
in的个数建议控制在200以内;
select id from t where phone=159or phone=136′;
=>
select id from t where phone in (’159′, ’136′);
(22)OR改写为UNION
mysql的索引合并很弱智
select id from t where phone =159or name = ‘john’;
=>
select id from t where phone=159
union
select id from t where name=’jonh’
(23)避免负向%
(24)慎用count(*)
(25)同上
(26)limit高效分页
limit越大,效率越低
select id from t limit 10000, 10;
=>
select id from t where id > 10000 limit 10;
(27)使用union all替代union
union有去重开销
(28)少用连接join
(29)使用group by
分组;
自动排序;
(30)请使用同类型比较
(31)使用load data导数据
load data比insert快约20倍;
(32)打散批量更新
(33)新能分析工具
show profile;
mysqlsla;
mysqldumpslow;
explain;
show slow log;
show processlist;
show query_response_time(percona);